Reducing Mobile Survey Drop-off
Without simplifying the product.
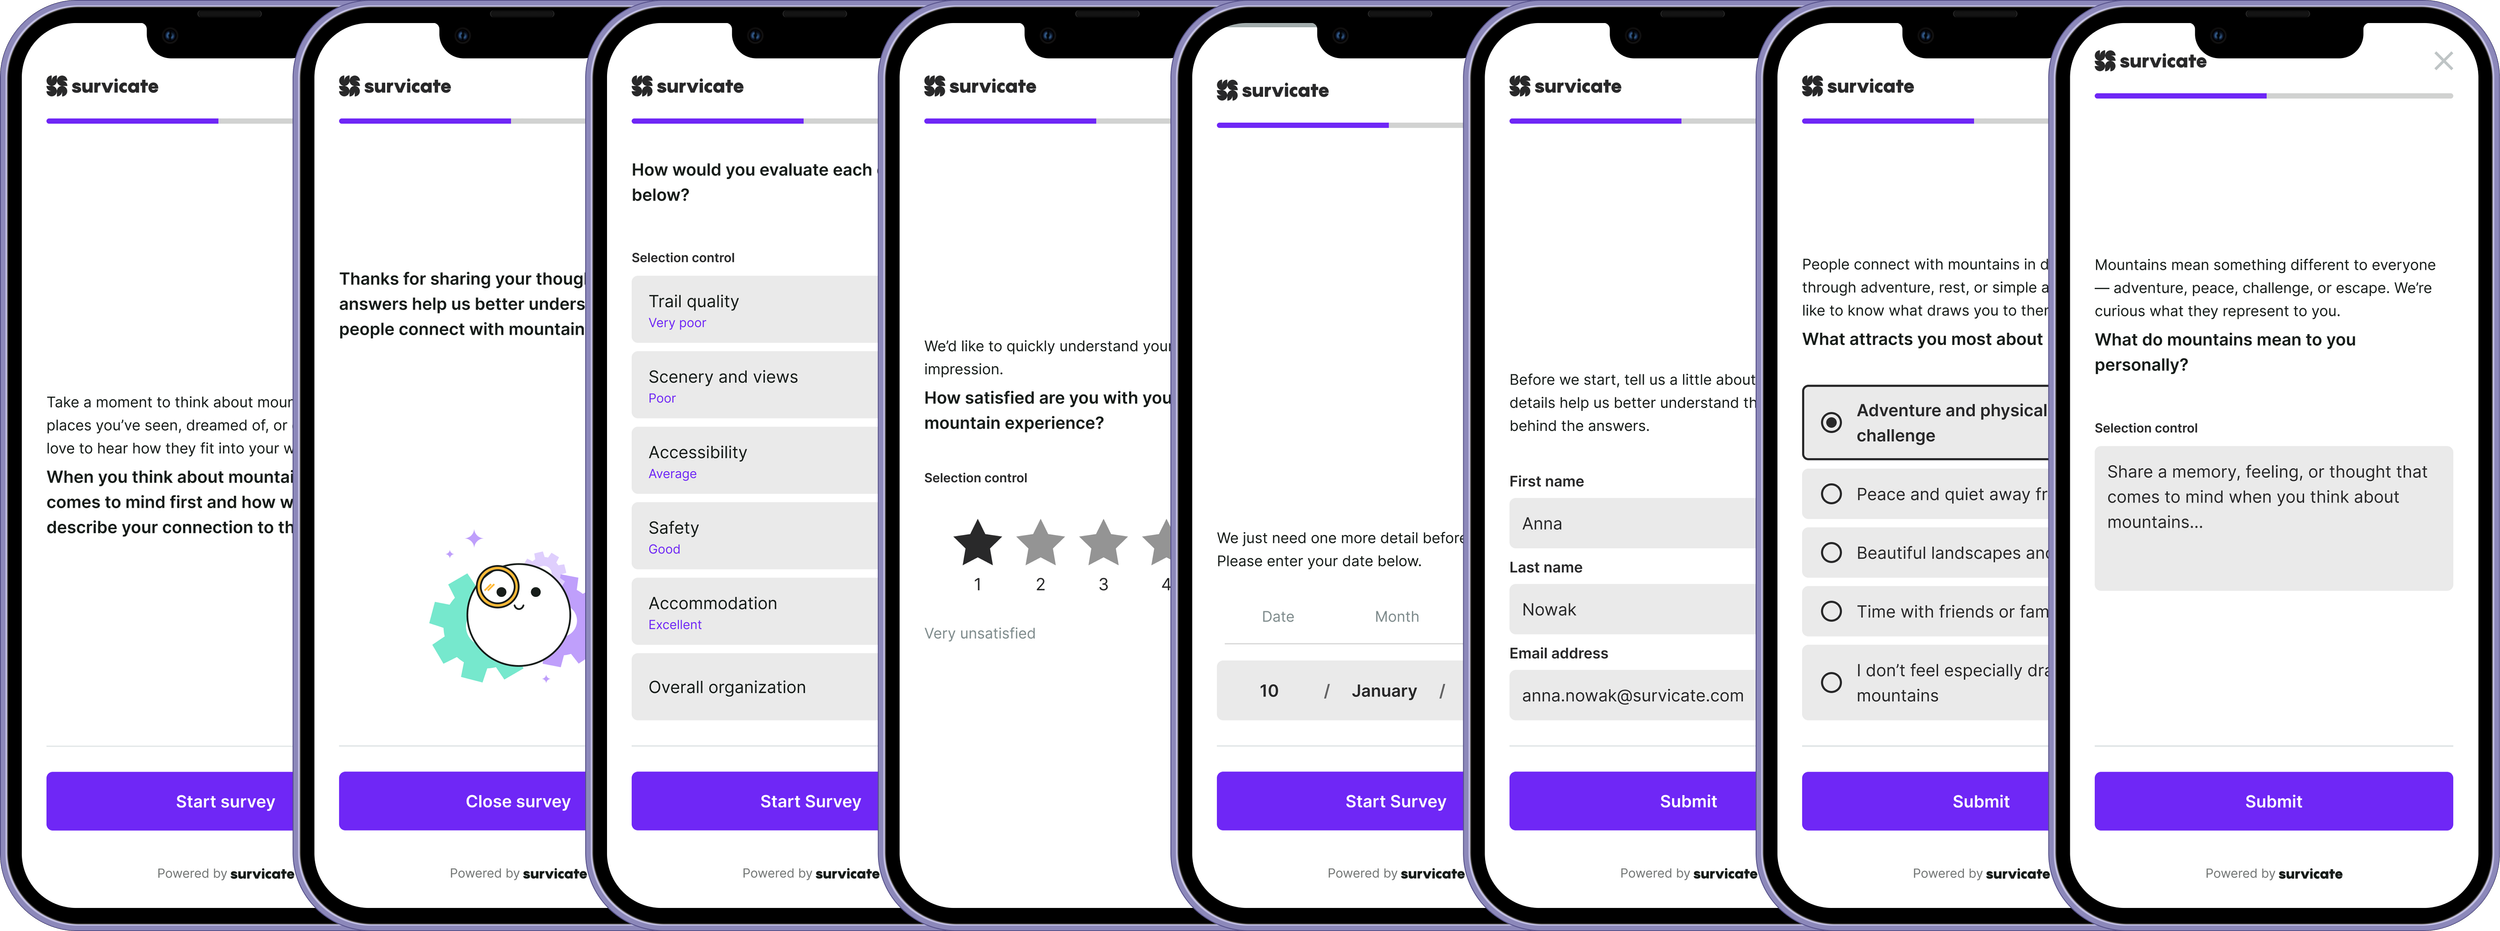
Mobile surveys weren’t failing because they were complex. They were failing because every step required too much effort.
My Role & Responsibilities
Role: Product Designer
Duration: 4 months
Team: 1 Product Manager, 3 Engineers, 1 Data Analyst
I led the end-to-end redesign of the mobile survey experience, collaborating with product, engineering, and analytics to identify friction points and improve survey completion.
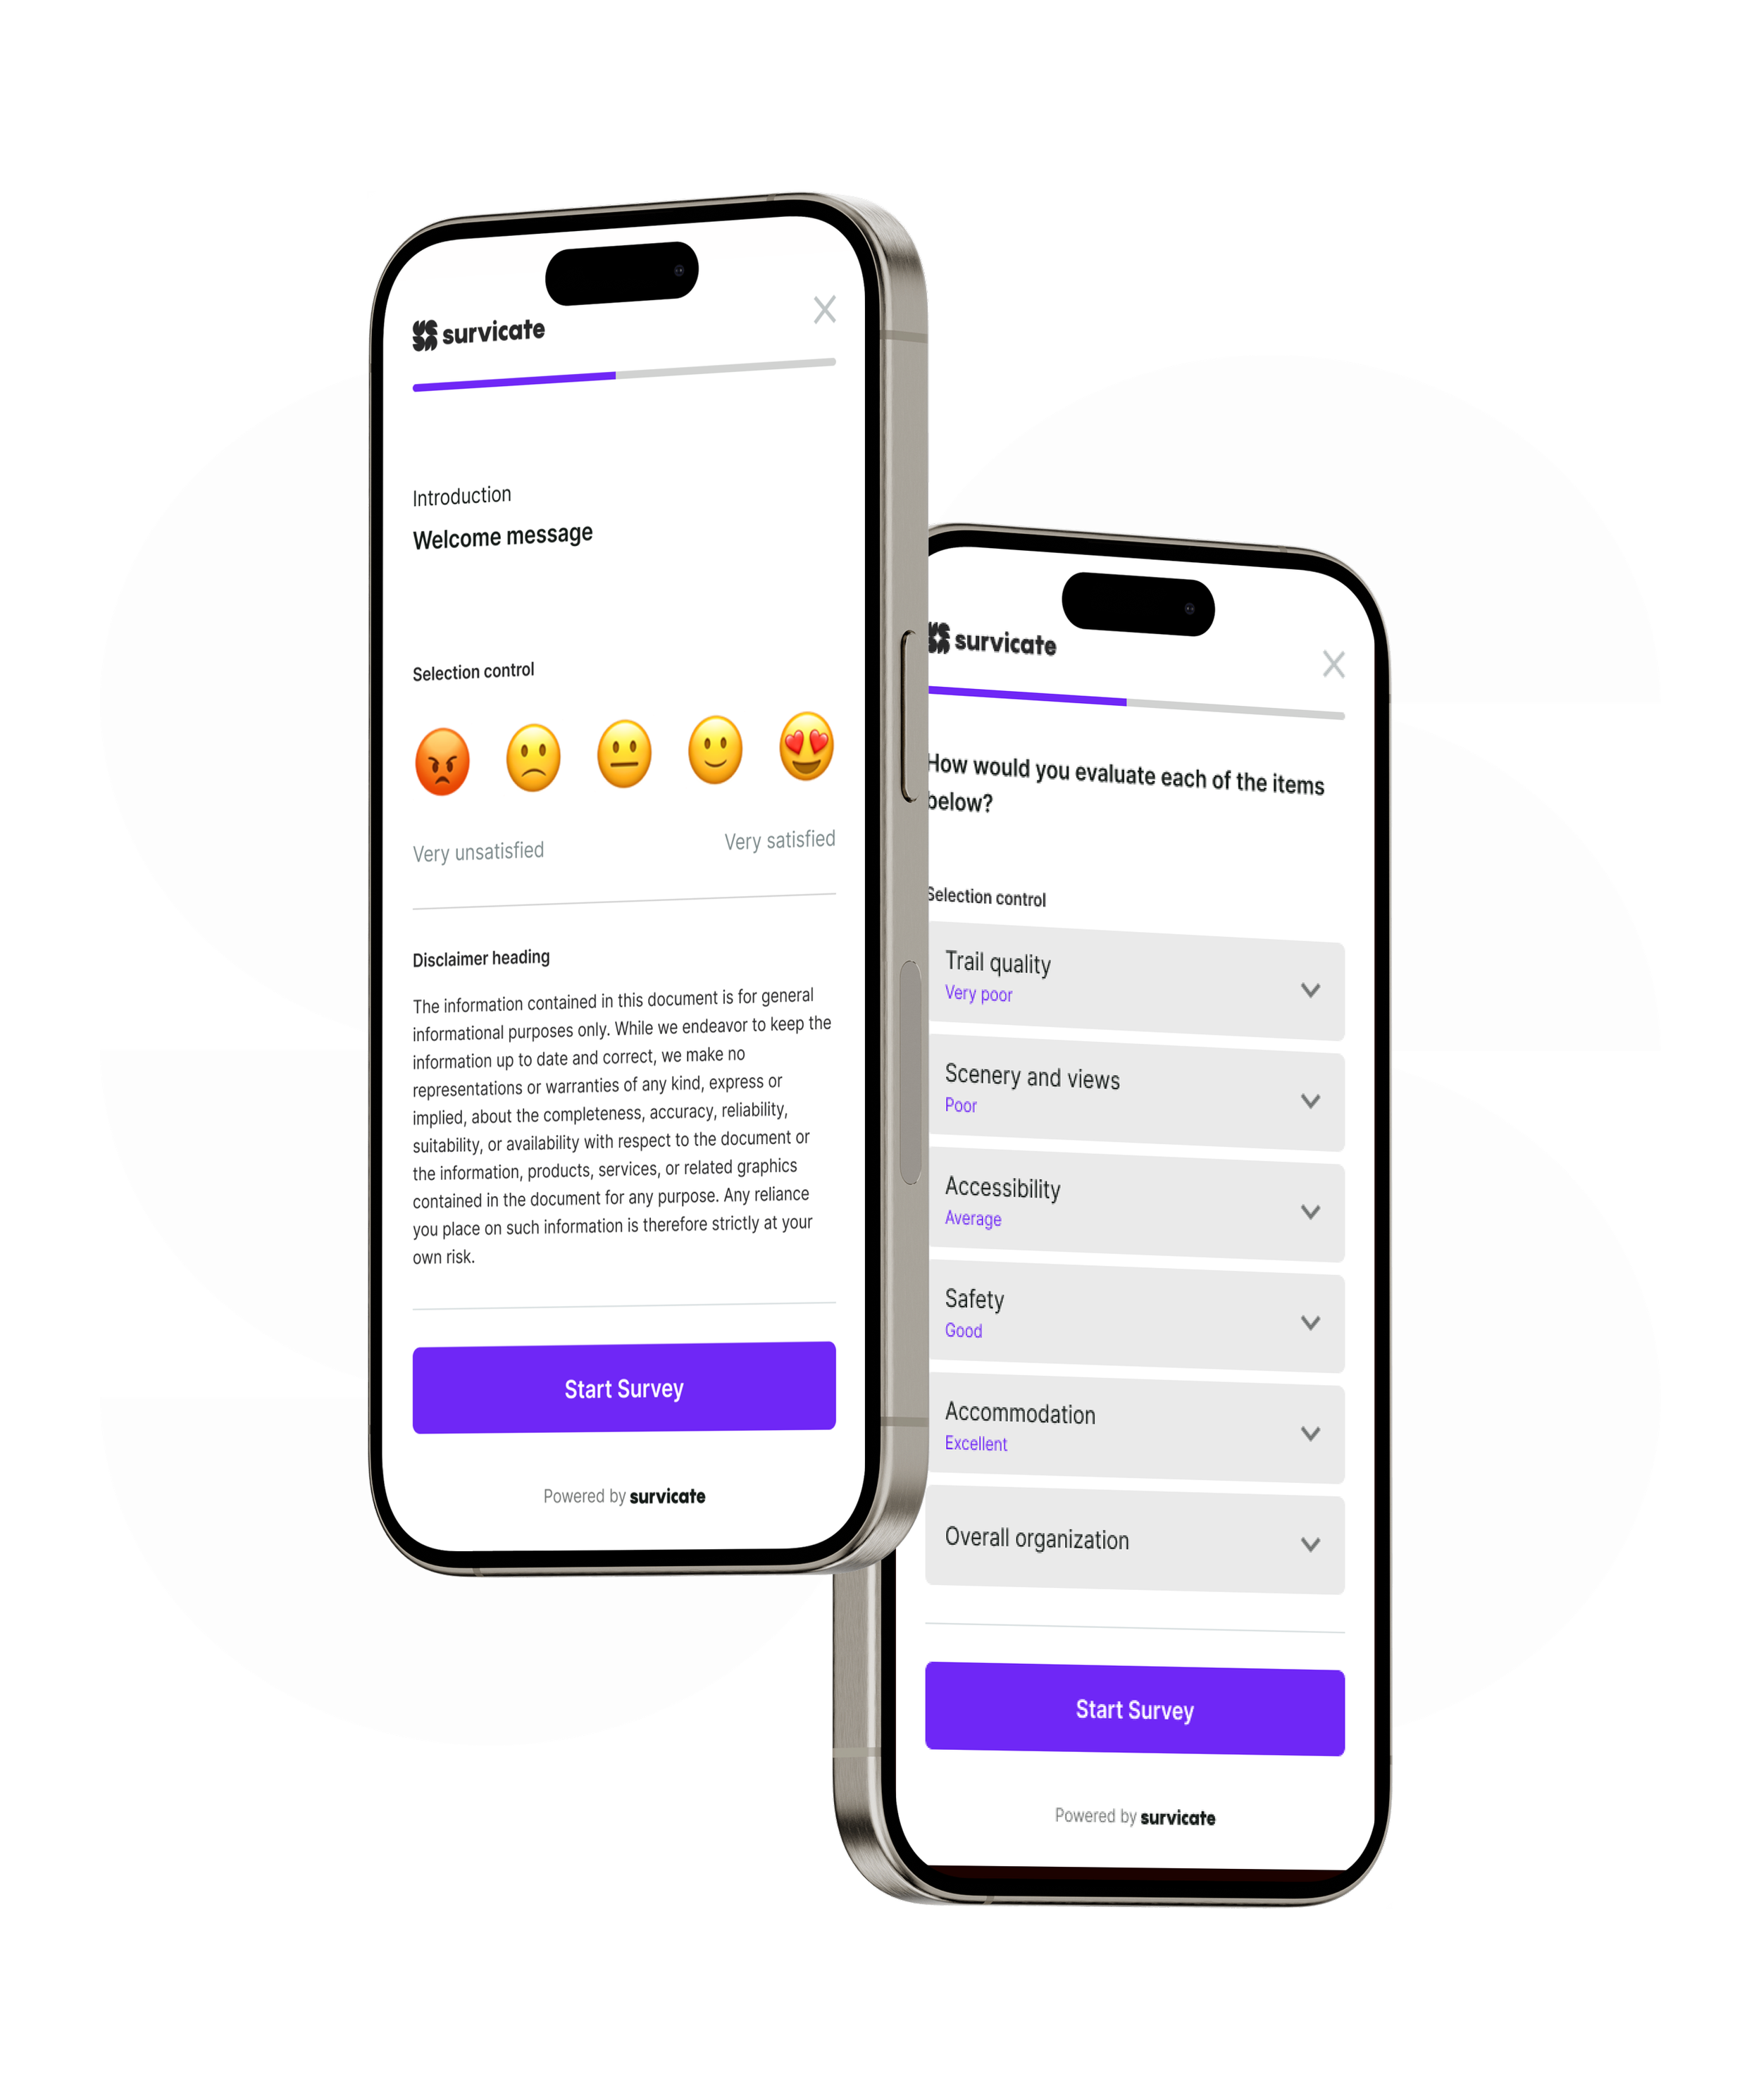
I owned the UX strategy, interaction design, and mobile UI system - from defining design principles and simplifying question flows to building reusable components across all supported question types.
The redesign focused on making surveys faster, easier to navigate, and less error-prone, while improving the reliability of the data collected.
Impact:
completion rate: 41% → 67%
avg. time to complete: -24%
mis-tap rate: improved tap accuracy and reduced interaction errors
mobile nps: +18 pts
* data based on mixpanel funnel analysis, firebase event tracking, and usability testing (n=12).
High drop-off on mobile
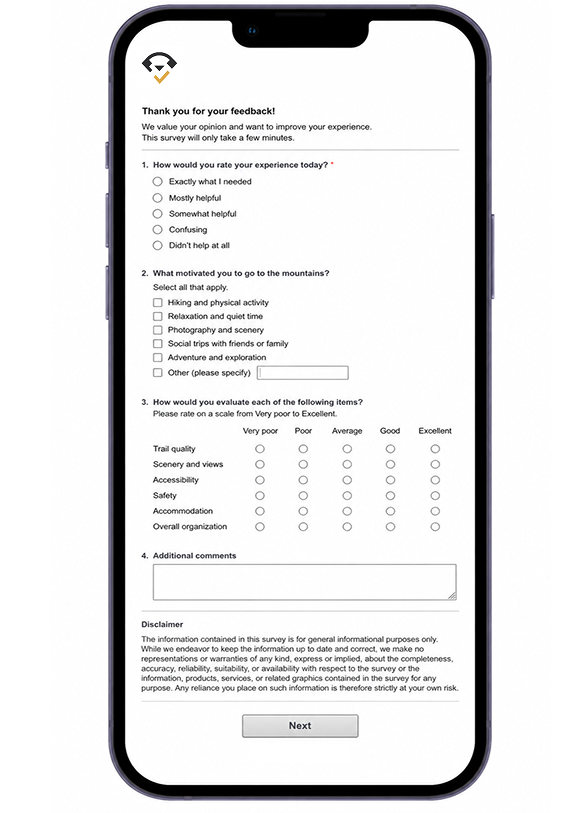
Surveys were originally designed for desktop environments. As usage shifted to mobile, the interaction model remained largely unchanged.
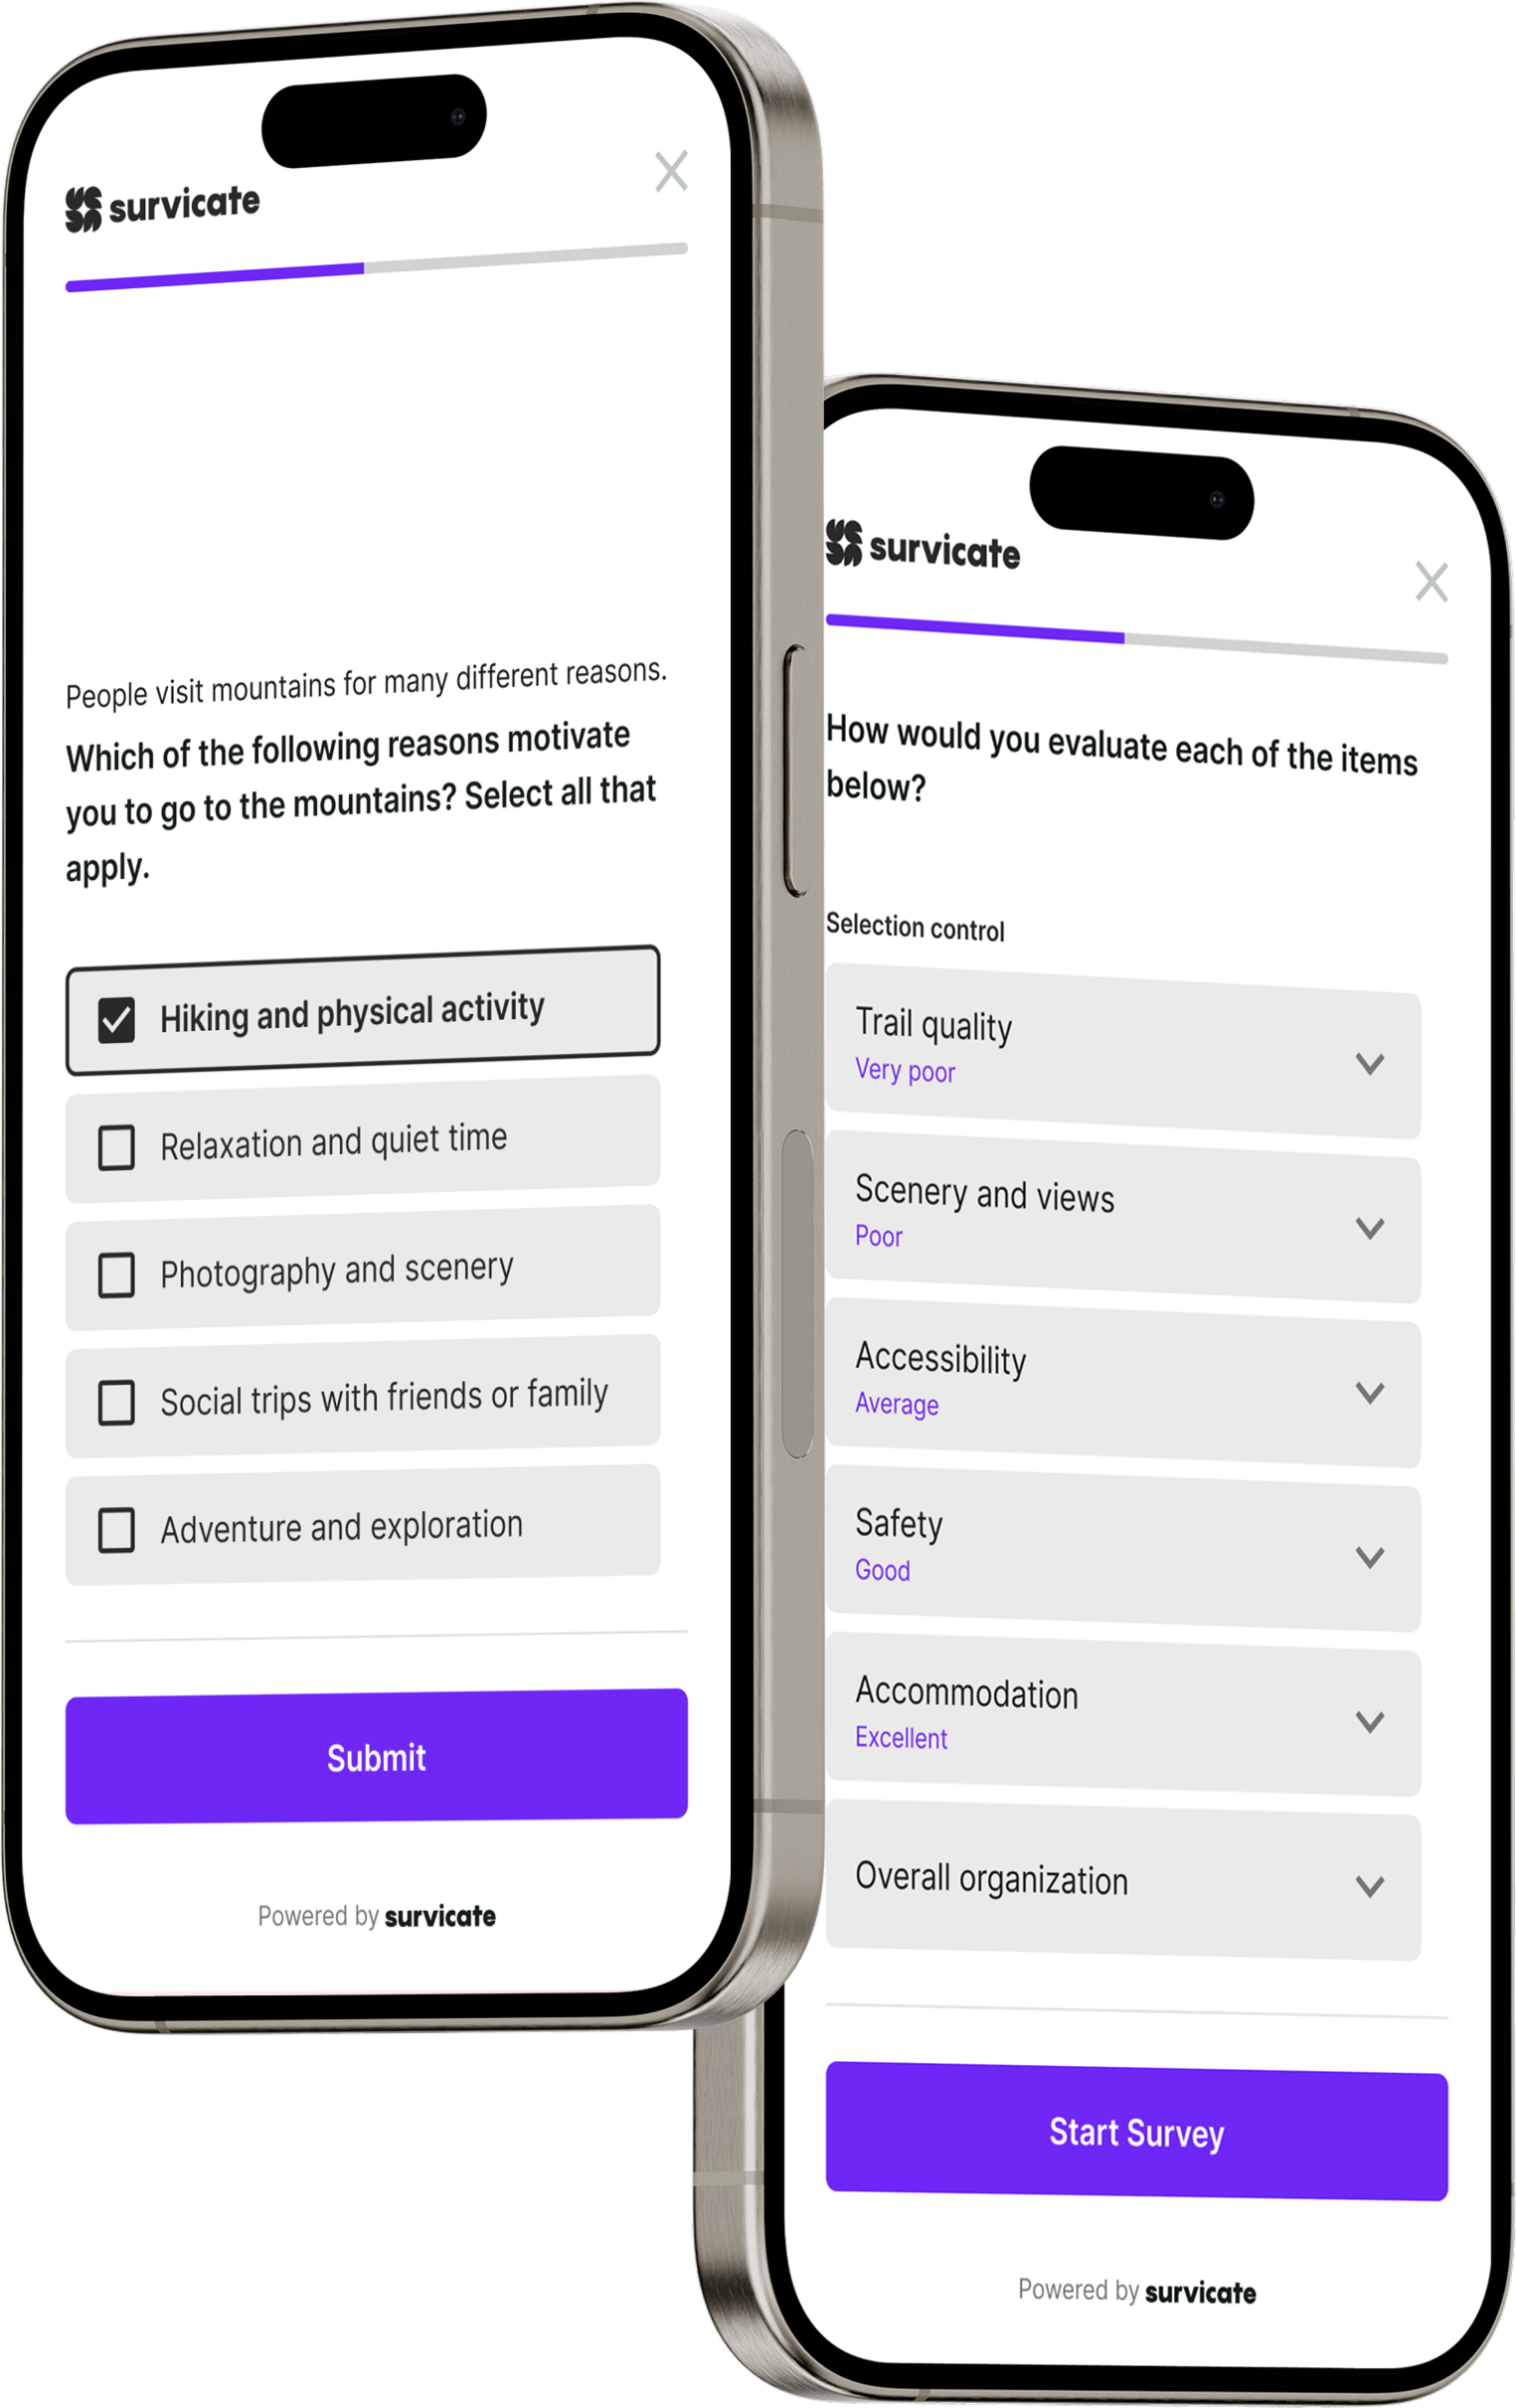
On mobile, this resulted in dense layouts, small tap targets, and too many inputs per screen. Even simple surveys required a high level of effort to read, process, and interact with.

Too many inputs on one screen
Multiple questions and input types competed for attention, overwhelming users and increasing the effort required to complete the survey.

Weak visual hierarchy
Questions, labels, and controls lacked clear prioritization, making it difficult for users to focus and understand what to do next.

Small tap targets
Small interactive elements made selections difficult on mobile devices, increasing the risk of accidental taps and interaction errors.
What we thought was the problem
At first, we assumed the main issue was layout responsiveness. We believed that making layouts more “mobile-friendly” and improving spacing would solve the problem.
This assumption turned out to be incomplete.

Research
To understand where and why users dropped off, we combined product analytics with qualitative research. We analyzed funnel data, interaction patterns, and time-to-complete metrics, and paired that with usability testing and session recordings.
Both sources consistently pointed to the same issue: users were not confused — they were overwhelmed by the interaction model.
Quantitative insights
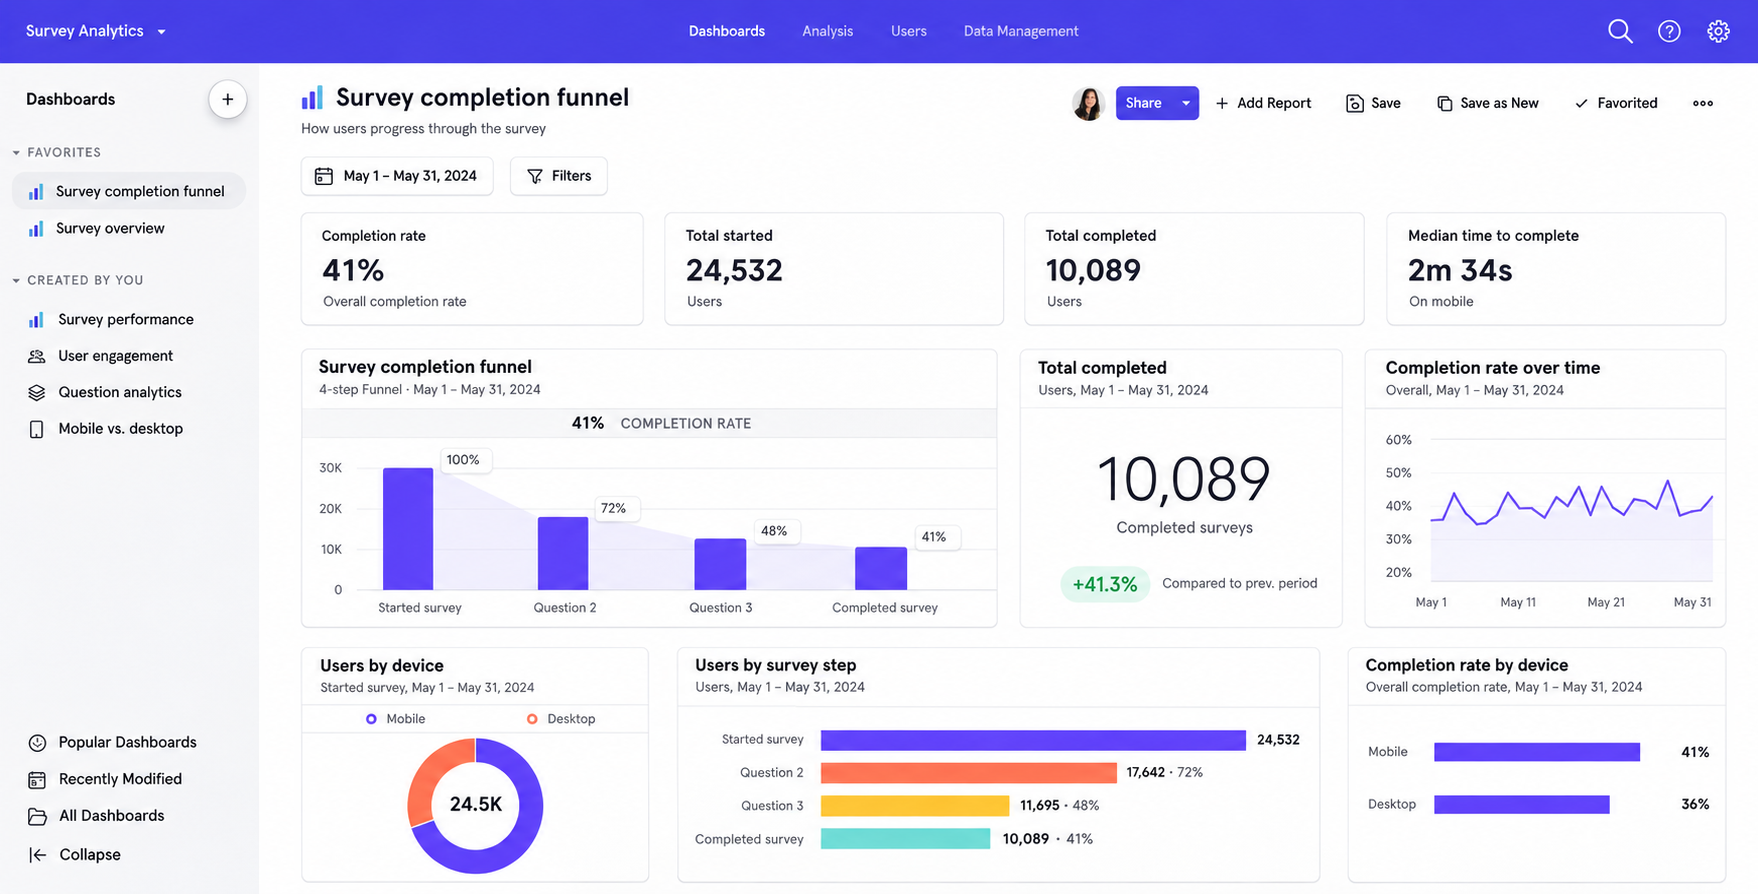
To understand the scale of these issues, we analyzed the existing survey completion funnel.
The data revealed an overall completion rate of just 41%, with significant drop-off during the first few questions.
Combining usability observations with funnel data helped us identify our primary design opportunity: reduce interaction friction and make mobile surveys easier to complete.
Qualitative insights
We started by conducting usability tests with 12 participants to understand how users interacted with mobile surveys and identify potential sources of friction.
During testing, we observed hesitation before selecting answers, accidental taps, and unnecessary scrolling. Several participants described the experience as tiring rather than confusing.
These findings suggested that the main challenge wasn't understanding the questions, but the effort required to interact with them.
Exploring solutions
To prepare for usability testing with 12 participants, we developed several test scenarios to explore different approaches to the mobile survey experience.
Each scenario focused on a specific design hypothesis, allowing us to observe user behavior, identify friction points, and evaluate the trade-offs between speed, clarity, and cognitive effort.
Direction 1 - reduce steps
We tried grouping multiple questions into a single screen to reduce the number of steps. This approach improved initial speed, but increased drop-off later in the flow.
Users delayed effort — but abandoned the survey when the screen became too demanding.
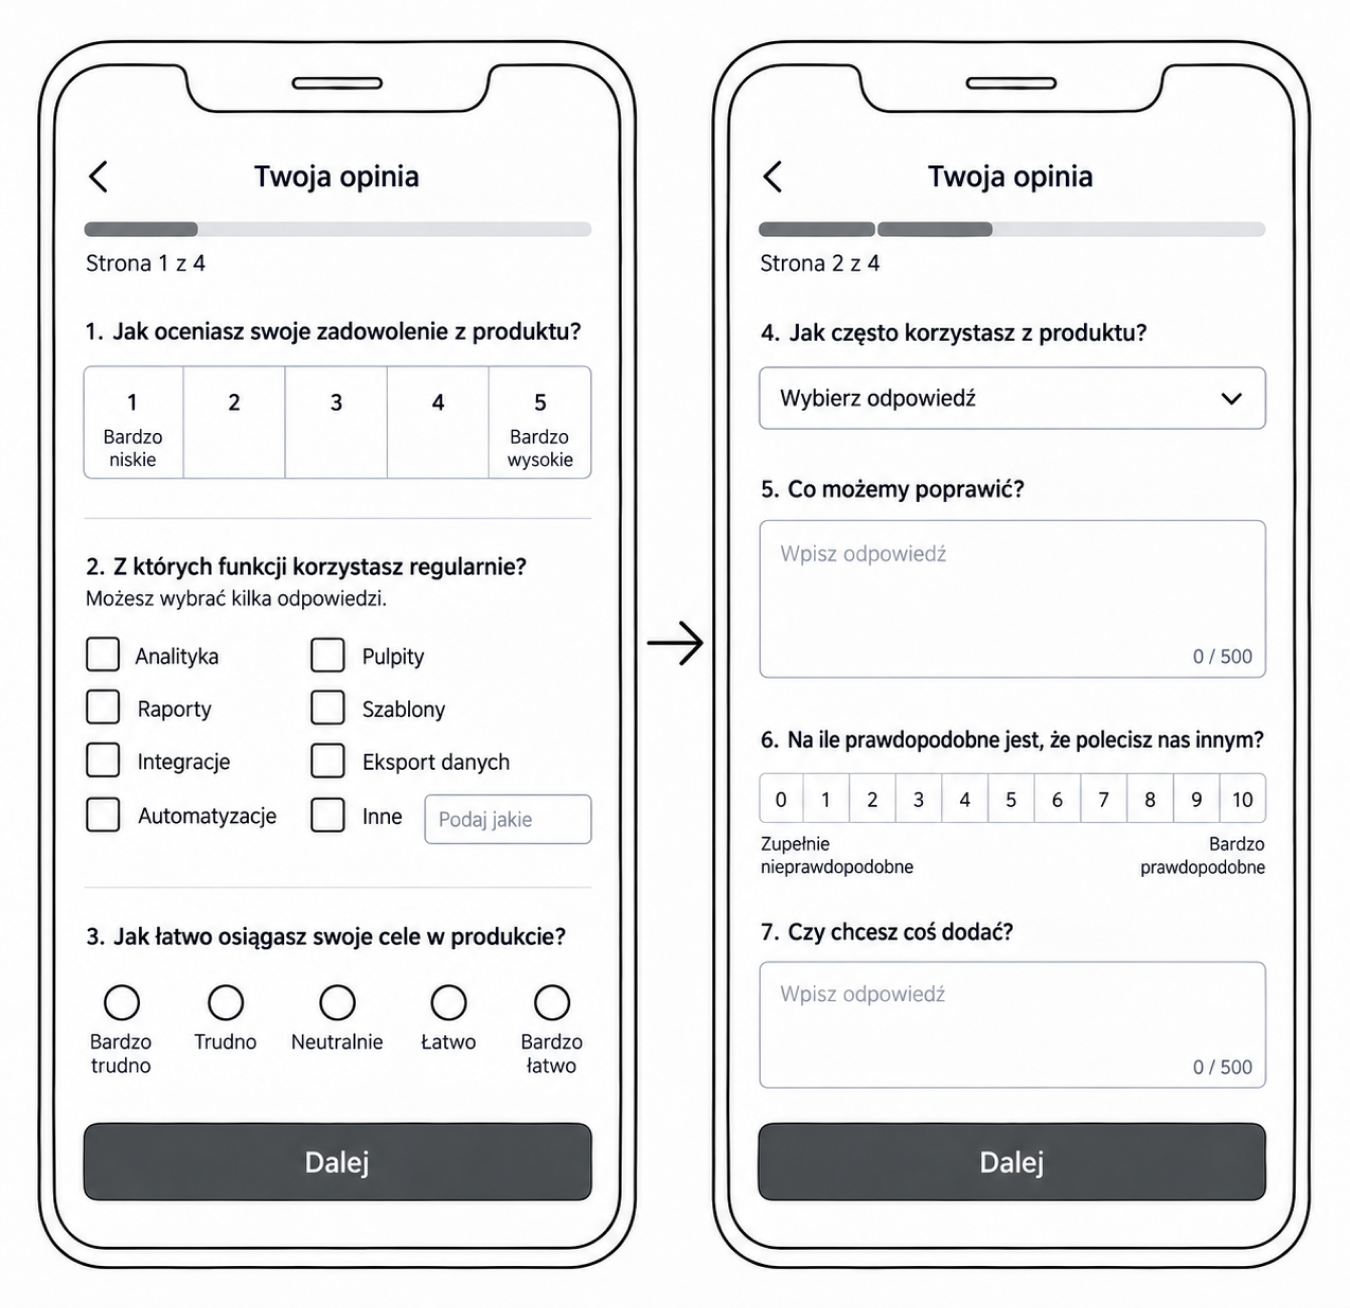
Direction 2 - one question per screen
We tested a single-question-per-screen approach to reduce cognitive load. This made each step easier to process and interact with.
Users moved slower, but more consistently.
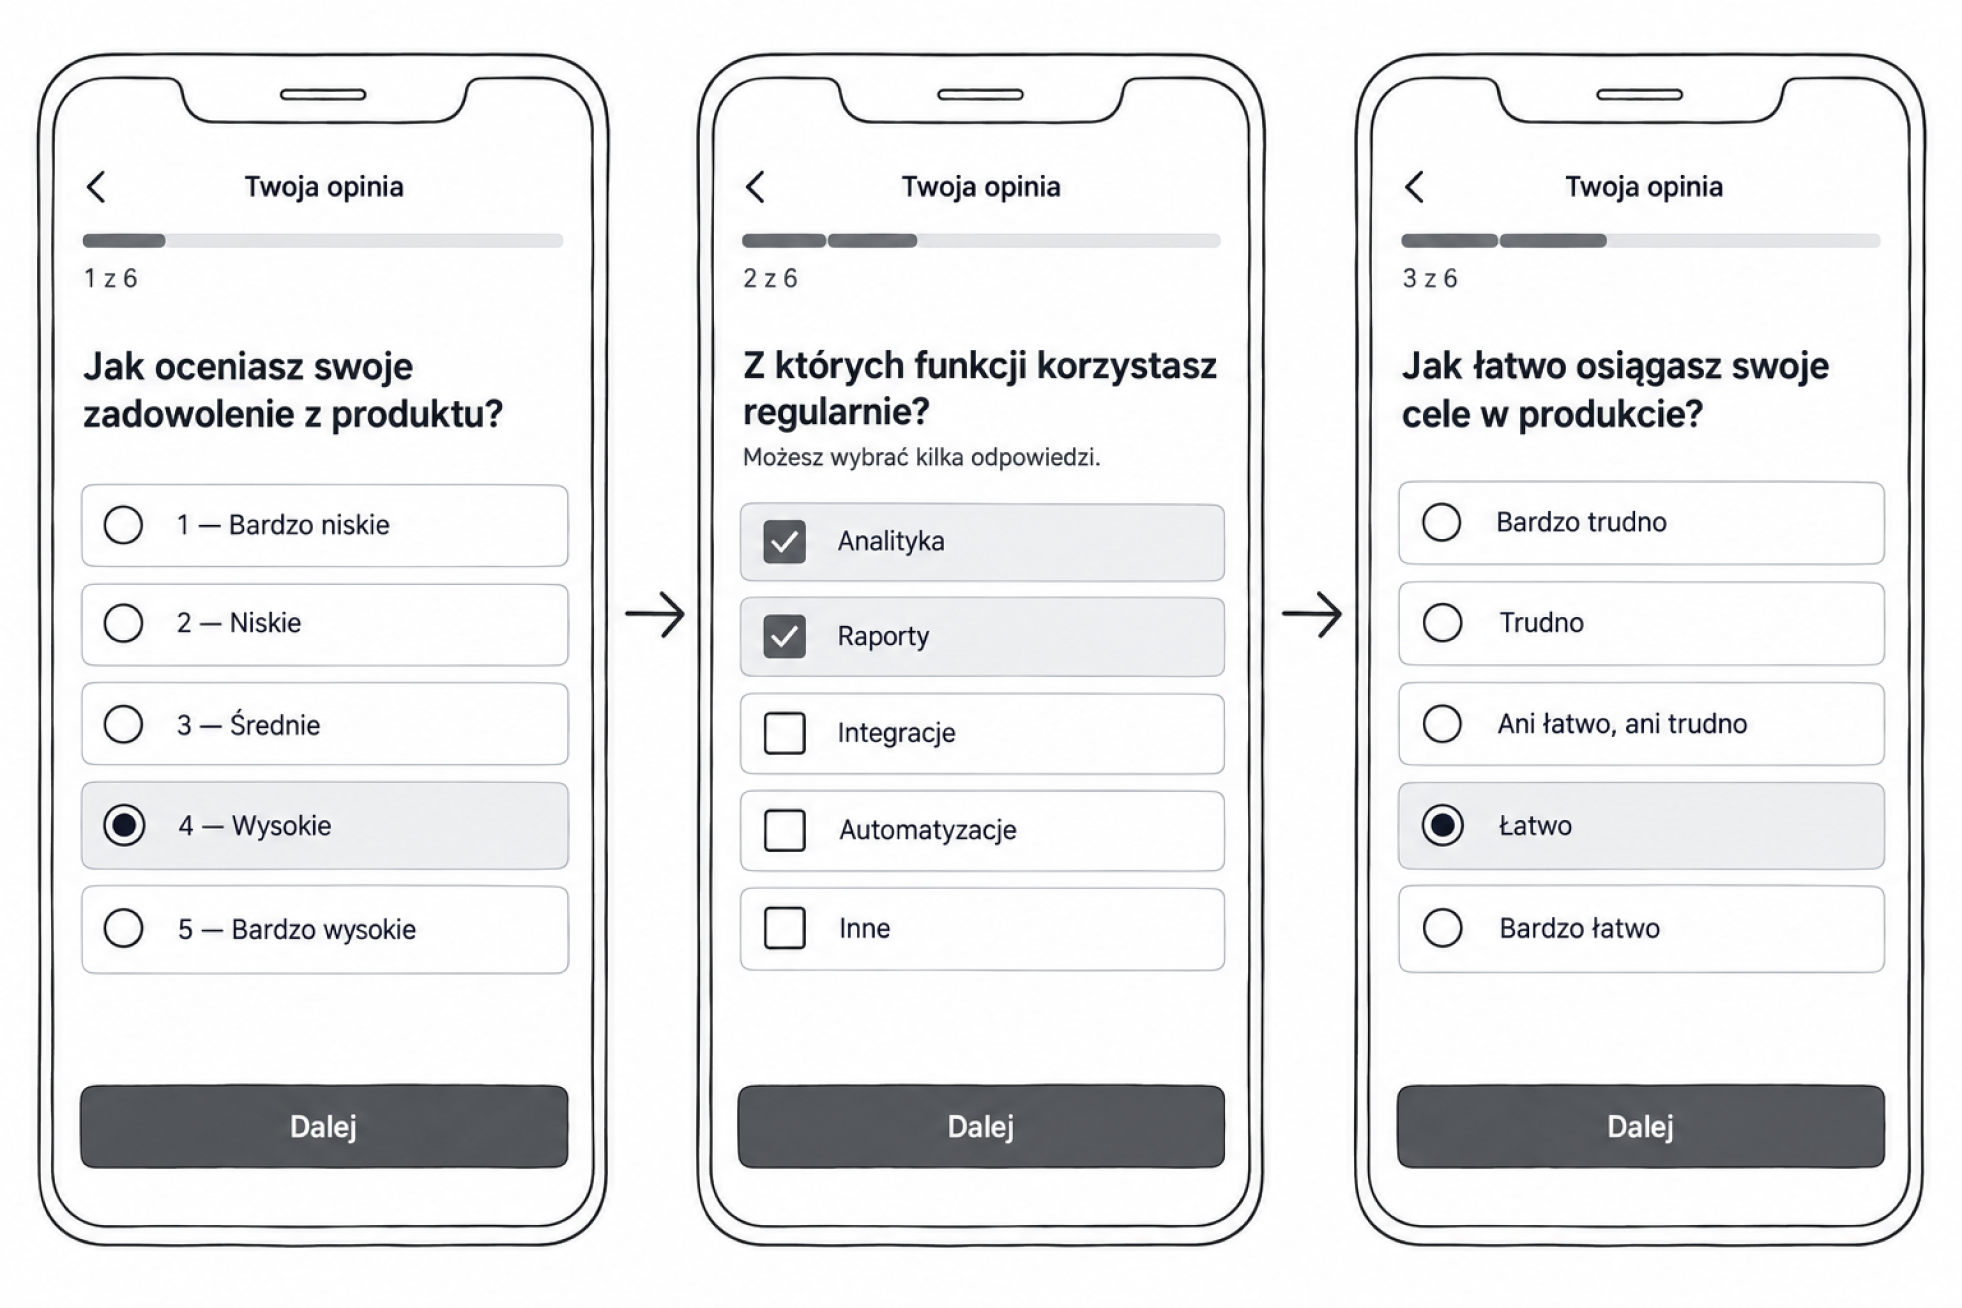
Direction 3 - hybrid grouping
We explored grouping related inputs while keeping some level of focus. This approach introduced additional complexity without clear benefits.
It didn’t significantly improve completion or usability.
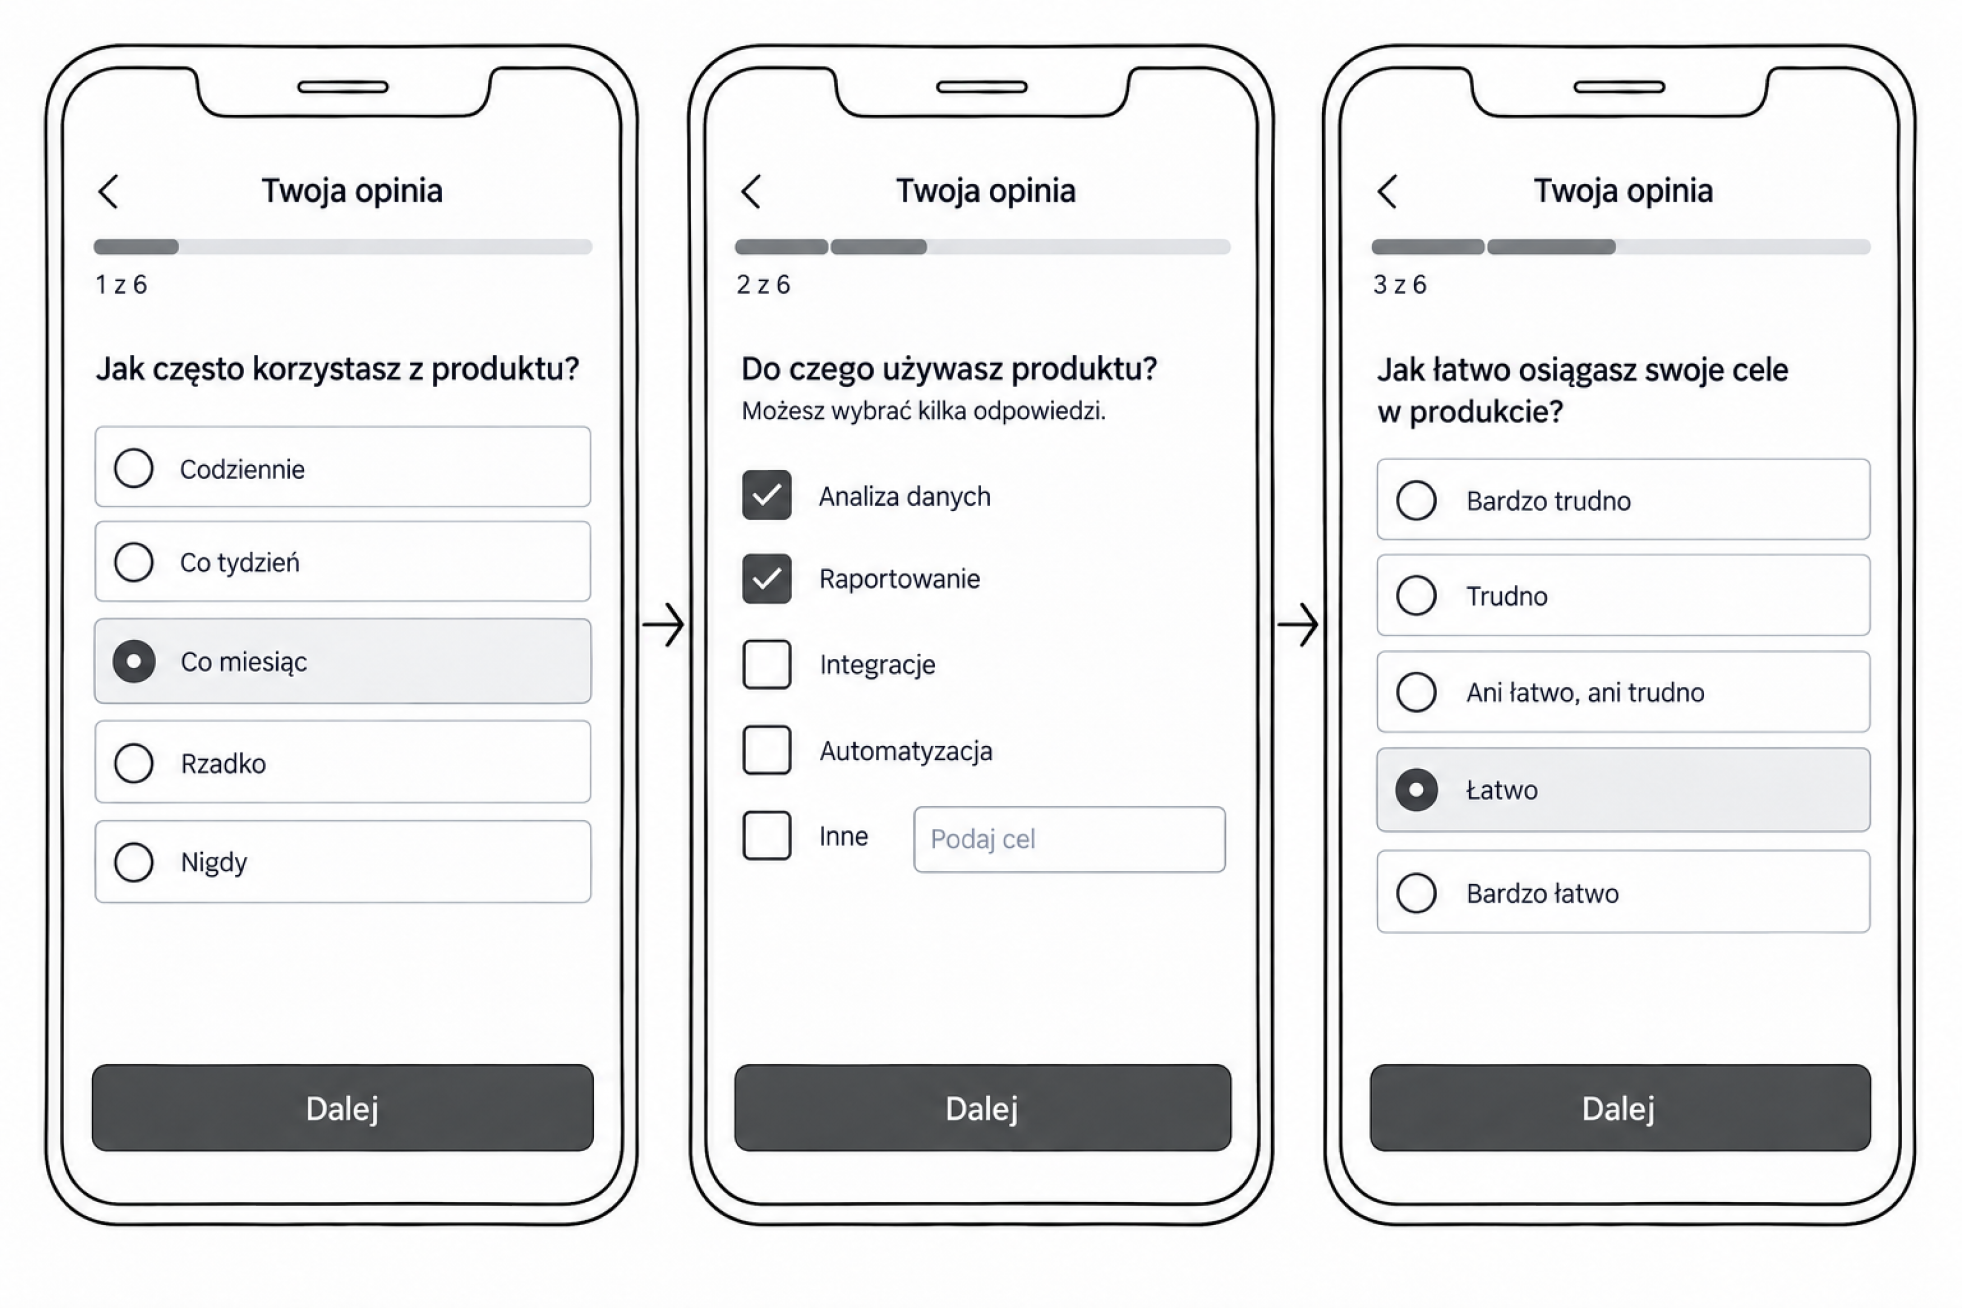
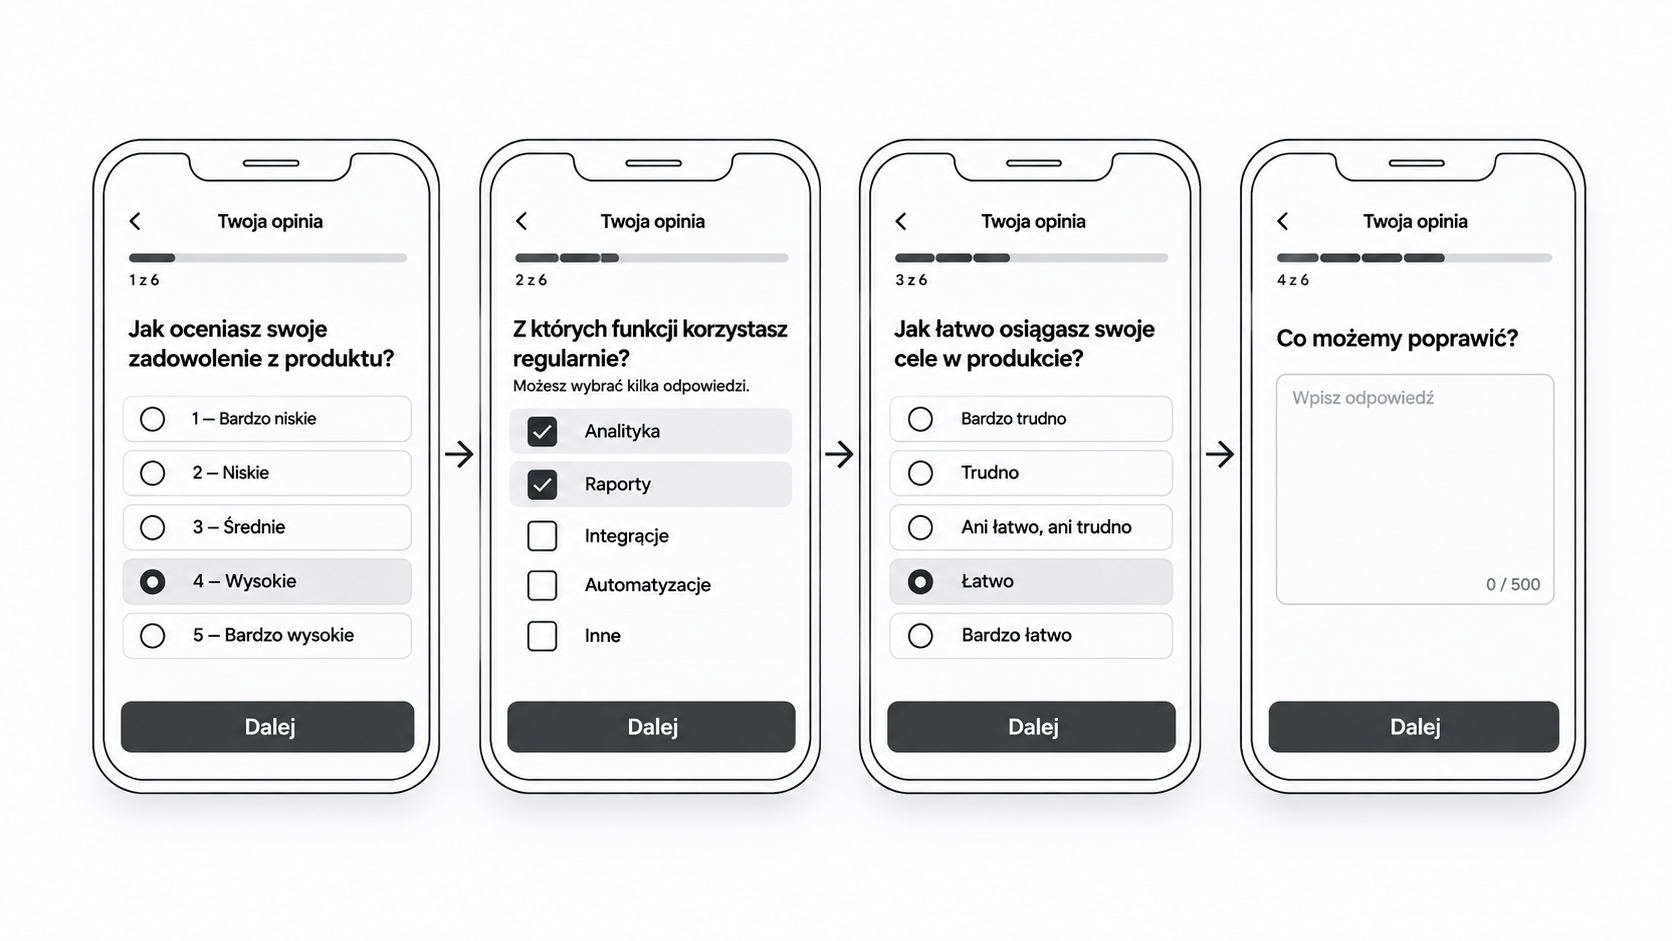
Decision.
Each direction solved a different problem — but only one improved completion without increasing friction. We chose to increase the number of steps.
Because reducing effort per step had a bigger impact than reducing total steps.
It provided the best balance between clarity, interaction speed, and completion rate. Each step required less effort, which improved overall flow despite increasing the number of steps
Building a mobile system
This redesign wasn’t just about improving individual screens. We needed to rethink how surveys behave as a system across different devices, contexts, and question types.
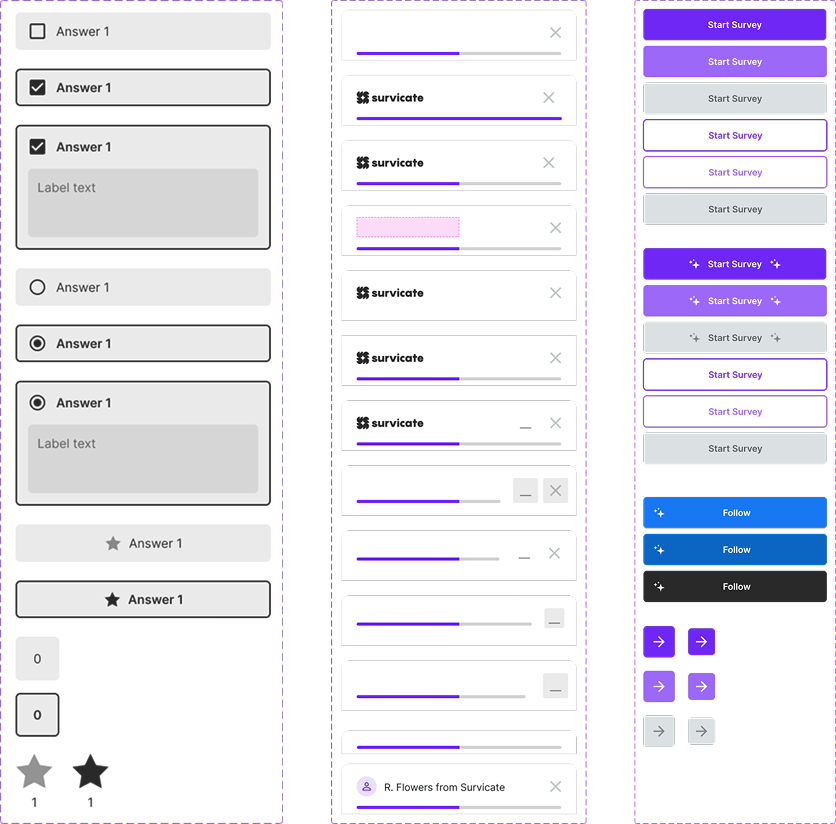
We started by redefining core interaction patterns for mobile. Every component was designed to be easy to tap, readable at a glance, and usable with one hand. This meant increasing tap areas, simplifying layouts, and removing unnecessary visual noise.
At the same time, we built a reusable mobile UI kit. Instead of designing screens one by one, we created a system of components that could scale across all survey types. This ensured consistency and made it easier to maintain and extend the product over time.
Because surveys were configured in a SaaS dashboard and rendered dynamically on mobile, we also had to ensure that what users set up matched what respondents experienced. This required defining clear rules for how configurations translate into UI.
We worked closely with engineers to adapt existing desktop components into mobile-first versions. Designs were delivered with defined states, behaviors, and constraints, which reduced ambiguity during implementation and improved handoff quality.
Accessibility
Accessibility was a core requirement throughout the design process, particularly for mobile users.
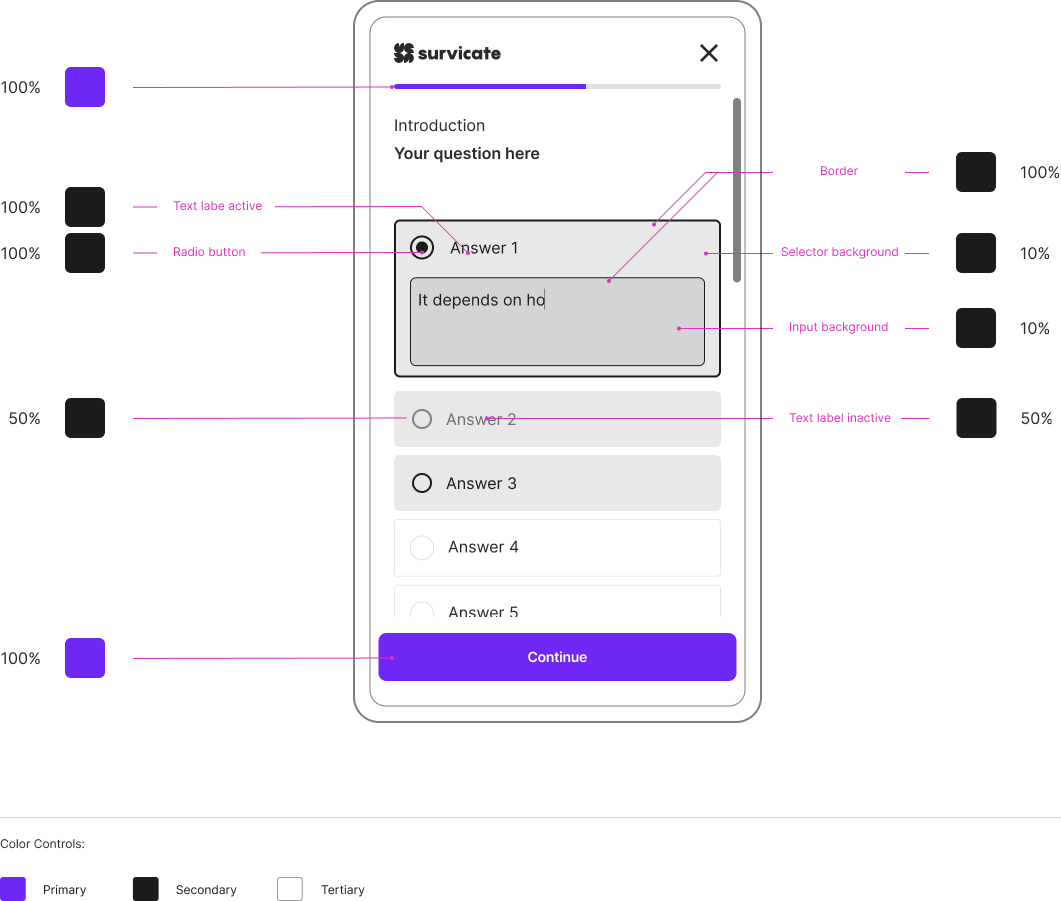
We designed with WCAG 2.1 AA standards in mind, focusing on sufficient color contrast, readable typography, appropriately sized touch targets, and clear visual hierarchy.
Our goal was to reduce interaction barriers and make surveys easier to navigate and complete, regardless of users' abilities or devices.
Key principle: Accessibility should be built into the experience, not added as an afterthought.
Customization
Survey creators needed the freedom to customize their surveys to match their brand, including colors and logos.
Initially, we explored enforcing strict accessibility rules to prevent problematic color combinations. While this reduced the risk of inaccessible designs, it also restricted creative freedom and introduced friction into the customization process.
Instead of blocking users, we shifted from restriction to guidance.
We introduced real-time contrast feedback, highlighted accessibility issues, and suggested alternative colors, while allowing creators to retain control over their designs.
This approach helped users make more informed decisions without sacrificing the flexibility they expected.
Key learning: Guide users toward better decisions instead of limiting their choices.
Outcome
The redesign had a measurable impact on how users interacted with surveys on mobile.
We focused on reducing cognitive load and simplifying interactions at each step, which directly improved completion and reduced friction across the flow.
Funnel impact
Before the redesign, the funnel showed a steep drop-off early in the flow, particularly between the first and third question. This suggested that users were encountering friction almost immediately after starting the survey.
After introducing a single-question-per-screen model, the funnel became significantly flatter. More users progressed step-by-step, and fewer abandoned the survey midway.
This shift indicated that users were no longer overwhelmed at the beginning of the experience.
What changed behavior
The improvement wasn’t driven by visual polish.
It came from restructuring how users interacted with the survey.
By reducing the number of decisions per screen, increasing tap comfort, and improving focus, we lowered the effort required to complete each step.
This made the overall experience feel faster and easier, even though the total number of steps increased.
Business impact
Higher completion rates translated into a larger volume of usable responses, improving the quality and reliability of collected data.
This allowed teams to make better product and business decisions based on more complete datasets, especially for longer and more complex surveys.
Validation
Metrics were tracked using Mixpanel funnel analysis and Firebase event tracking, based on events such as:
survey_started
question_answered
survey_completed
These quantitative insights were supported by usability testing (n=12), where we observed reduced hesitation, fewer interaction errors, and smoother progression through the survey.